
How Accurate Is a TDEE Calculator?
A TDEE calculator gives you a reasonable starting estimate, not a measurement. The resting-metabolism part is usually close for most healthy adults. The activity part is where the real uncertainty sits. Individual results can miss by a few hundred calories a day, so treat the number as a hypothesis and let your scale test it.
Is a TDEE calculator accurate?
TDEE stands for total daily energy expenditure, the calories you burn in a day. Calculators build that figure in two steps. First they estimate your resting energy use (BMR or RMR) from your sex, age, height and weight. Then they multiply by an activity factor.
The first step is well studied. The second is mostly a guess about how you live.
In practice:
- The best-validated resting formula (Mifflin-St Jeor) lands within 10% of measured values for most healthy adults, but not all.
- Activity multipliers add error that no formula can remove, because they are broad categories.
- Your own metabolism, dieting history and day-to-day movement add further individual variation.
- A few weeks of tracking your weight against your intake will tell you more than any calculator.
What TDEE is and what it includes
TDEE is the number of calories you burn in 24 hours, which makes it the intake that holds your weight steady. It has four parts, and a formula predicts only the first one well.
Resting metabolism (BMR or RMR)
Breathing, circulation, brain function and other basics
About 60 to 70% share of tdee
Thermic effect of food (TEF)
Energy used to digest, absorb and store what you eat
About 10% share of tdee
Exercise
Planned workouts and sports activities for your routine.
Roughly 0 to 10%share of tdee
NEAT
Walking, chores, standing, fidgeting and other daily movement
The remainder, roughly 15 to 20% of tdee
Shares differ between people and between sources, so read these as ranges, not fixed splits. TEF also depends on what you eat: protein costs roughly 20 to 30% of its calories to process, carbohydrate about 5 to 10%, and fat about 0 to 3%. Because TEF is only around a tenth of the total, shifting your macros moves TDEE by a small amount.
TDEE vs BMR
BMR is the resting part. TDEE is BMR plus everything else. Calculators use BMR as an input, but your daily calorie target should come from TDEE, because that includes the energy you spend moving and eating.
How a TDEE calculator works
Most calculators use the Mifflin-St Jeor equation, published in 1990. The simplified version is:
- Men: (10 × weight in kg) + (6.25 × height in cm) − (5 × age) + 5
- Women: (10 × weight in kg) + (6.25 × height in cm) − (5 × age) − 161
The result is multiplied by an activity factor, commonly 1.2 for sedentary, 1.375 for lightly active, 1.55 for moderately active, 1.725 for very active, and 1.9 for extra active.
Here is what that looks like for a 35-year-old man who is 5’10” (178 cm) and 176 lb (80 kg):
|
Activity level |
Multiplier |
Estimated TDEE |
|
Sedentary |
1.2 |
about 2,090 kcal |
|
Lightly active |
1.375 |
about 2,396 kcal |
|
Moderately active |
1.55 |
about 2,701 kcal |
|
Very active |
1.725 |
about 3,006 kcal |
|
Extra active |
1.9 |
about 3,311 kcal |
His BMR is the same in every row, about 1,743 kcal. The activity choice alone moves the answer by more than 1,200 calories. That is why picking the right category matters more than most people expect.
How accurate are the formulas themselves?
The 1990 Mifflin study derived the equation from 498 healthy adults aged 19 to 78, including both normal-weight and obese participants. Resting energy was measured by indirect calorimetry, and the equation explained about 71% of the variation (R² = 0.71). The authors also found that the 1919 Harris-Benedict equations overestimated measured resting energy by 5% in their sample.
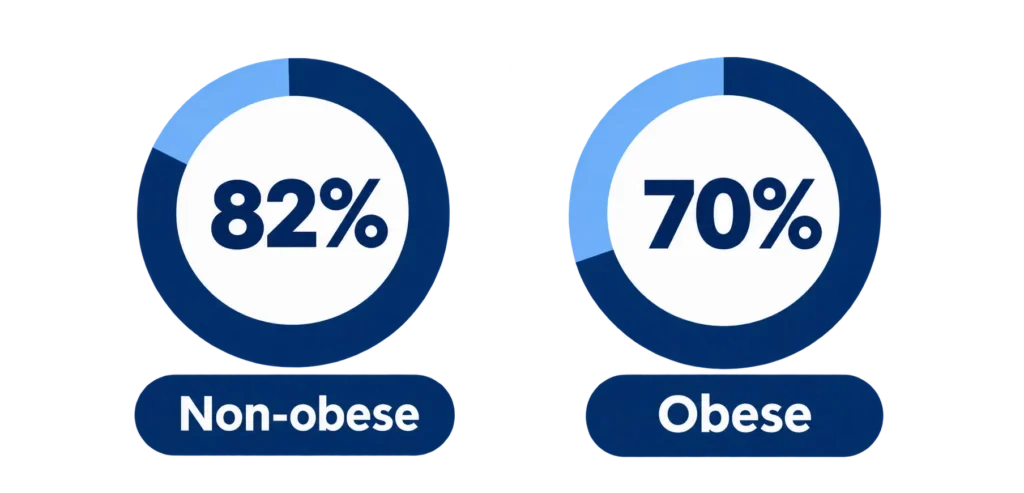
A 2005 systematic review by Frankenfield and colleagues compared the four equations most used in clinical practice: Harris-Benedict, Mifflin-St Jeor, Owen, and the WHO/FAO/UNU equations. Mifflin-St Jeor predicted resting metabolic rate within 10% of measured in more people than any other equation, and it had the narrowest error range.

Report roughly 82% of non-obese and 70% of obese individuals falling within that 10% window.
Two Key Takeaways
1.First, “most accurate” is relative
- Even the best equation misses by more than 10% for roughly one in five non-obese adults and about three in ten adults with obesity.
- The review also warns that people from groups underrepresented in validation studies should be more skeptical of any equation.
2.Second, the unexplained 29% is real
- Weight, height, age and sex capture most of what can be predicted.
- In the original study, adding body-weight distribution did not significantly improve the fit.
- Fat-free mass alone was a weaker predictor (R² = 0.64) than the practical equation.
3.Some groups fare worse
One study of 47 healthy young women found that six common equations, Mifflin-St Jeor and Harris-Benedict among them, all overestimated measured resting metabolic rate, by 140 to 738 kcal a day. Treat that as one small sample, but it shows why individual results vary.
Which TDEE formula is most accurate?
For people who don’t know their body fat percentage, Mifflin-St Jeor has the strongest evidence behind it. Harris-Benedict is older and overestimated in the original Mifflin sample.
Do lean-mass formulas like Katch-McArdle or Cunningham do better?
They can, for the right person. Both use fat-free mass, so they need a body fat figure, and home estimates from scales or calipers carry their own error straight into the result. In the 1990 data, fat-free mass alone predicted resting energy (R² = 0.64) slightly worse than the practical equation based on weight, height, age and sex (R² = 0.71). For most people, a body fat input does not buy extra accuracy.
What is the most accurate formula for athletes?
Athletes are the main exception. In a study of 90 recreational athletes, the Harris-Benedict, WHO, Schofield, Mifflin-St Jeor and Owen equations each predicted resting energy accurately for fewer than half of participants, while the lean-mass-based Cunningham equation performed well. A systematic review and meta-analysis of athlete studies found no single guaranteed winner, but equations derived from athletes tended to perform best, and the athlete-specific ten Haaf equation (age, weight, height) was the most precise, with about 80% of participants within 10% of measured values. Another study of 50 collegiate athletes found that all five tested equations underestimated resting metabolic rate.

In practice
If you train many hours a week, expect a Mifflin-based number to run low at rest, and lean on your tracked results. If you are a casual gym-goer with typical body composition, start with Mifflin-St Jeor and let tracking correct it.
How far off can a TDEE calculator be?
There is no single well-established error figure for whole-TDEE calculators, only pieces of the picture. The resting estimate is within 10% of measured values for most healthy adults, which for the example man (BMR about 1,743 kcal) is roughly 175 calories either way. Activity then adds more. Moving up or down one category in the multiplier table shifts his estimate by about 300 calories (2,396 versus 2,701 kcal for lightly versus moderately active). A study of ten TEE equations against doubly labeled water found sizable errors for individuals, and MacroFactor describes calculator estimates as routinely off by several hundred calories.
The working takeaway: expect a plausible miss of a few hundred calories in either direction, larger for some people, and plan to correct it.
Where the larger errors come from?
Activity multipliers
Activity multipliers are broad estimates, and people with the same activity level may burn different calories. Research shows physical activity is the most variable part of daily energy use. A 2024 study found errors in all ten tested models. Use estimates as a starting point and adjust based on weight trends over two to three weeks.
Everyday movement
Fidgeting, standing and walking around make up non-exercise activity thermogenesis (NEAT). In a well-known 1999 overfeeding study of 16 non-obese adults, about two-thirds of the rise in daily energy expenditure came from NEAT. Changes in NEAT also predicted who stored more fat. No calculator input captures this. Your NEAT can shift without you noticing, especially when you diet or overeat.
Dieting history and metabolic adaptation
Significant weight loss can reduce energy expenditure beyond what body size predicts. One study found former weight-loss contestants burned about 499 fewer calories daily than expected six years later. This extreme case isn’t typical, but it shows calculators cannot account for individual metabolic adaptations.
Your own food log
Calculators aren’t the only source of error. People may underestimate food intake and overestimate activity. One study found 47% underreporting of calories and 51% overreporting of activity in ten adults. Track portions, cooking oils, and restaurant meals carefully before blaming the formula.
How to make your estimate more accurate?
The practical fix is simple. Use the calculator for a starting point, then test it against your own weight trend.
- Calculate your estimate with Mifflin-St Jeor and pick your activity level honestly. If you are unsure between two categories, pick the lower one.
- Eat at that number for two to four weeks. Weigh yourself at the same time each morning and weigh your food where you can.
- Compare your weekly average weight. Daily readings swing with water and digestion, so look at averages.
- Adjust in small steps. If your weight is clearly rising, lower intake by about 100 to 200 calories. If it is falling, raise it by the same amount.
- Repeat until your weight holds steady. That intake is your working maintenance level.
This approach is common practice among nutrition coaches and apps rather than a formally validated protocol, but it works because it measures your actual energy balance instead of predicting it.
Some calculators and apps automate this by combining your logged intake with your weight trend. The NIH’s Body Weight Planner, built from research by Kevin Hall’s group at NIDDK, takes a related approach by modeling how diet and activity changes affect weight over time. It is intended for adults 18 and older and is not for pregnant or breastfeeding women.
How to choose an activity level
Choose activity based on your typical day, not workouts. Desk jobs with gym sessions often fit lightly active. If unsure, choose lower to avoid overestimating calorie needs or double-counting exercise.
If your results don’t match the calculator
Suppose a calculator gives you 2,400 calories and you gain weight eating 2,200. Taken at face value, your true maintenance is below 2,200, so the calculator ran at least 200 calories (about 8%) high. That is within what the research would lead you to expect. It is also exactly what underreported intake looks like, so work through it in order:
- Weigh your food for one to two weeks and log every cooking oil, drink and snack.
- Re-check your activity level against an ordinary day, not your best week.
- If the scale still disagrees, lower your target by 100 to 200 calories and review after two weeks.
Using your TDEE to lose, gain or maintain weight
TDEE is a maintenance estimate, so eating at it should hold your weight steady, not reduce it. To lose weight you eat below it, and to gain you eat above it.
General public-health guidance commonly cited for gradual weight loss is about 1 to 2 pounds a week. With the standard rule of thumb of 3,500 calories per pound, that works out to roughly 500 to 1,000 calories a day below maintenance. The rule is an approximation, because weight change slows as your body adapts, so judge progress by your weight trend rather than the arithmetic. Coaching sources also suggest percentage-based targets, such as 20 to 25% below TDEE for faster fat loss or 5 to 10% above for lean gain. Those are conventions, not established thresholds.
Estimation error matters most when the deficit is small. If your TDEE is overestimated by 250 calories and you cut 500, your real deficit is about 250.
Can you raise your TDEE?
Yes, but the effects are smaller than marketing suggests.
Move more outside workouts
In the 1999 overfeeding study, NEAT accounted for about two-thirds of the rise in daily energy expenditure and differed widely between people.
Add planned exercise
It typically accounts for roughly 0 to 10% of TDEE, so its contribution is real but limited.
Eat enough protein
Protein has the highest thermic effect, but TEF is only around a tenth of TDEE, so the change is modest.
Hold on to muscle
Fat-free mass was the best single predictor of resting energy use in the 1990 data, so preserving it during a diet supports your resting burn. Avoiding extreme crash dieting limits the metabolic adaptation described above.
When a TDEE calculator is less reliable
Be more cautious if any of these apply:
- You have obesity. The best equation was within 10% for fewer people in this group, and your numbers may need more weeks of data before a pattern is clear.
- You have lost a large amount of weight recently.
- You train many hours a week or carry unusually high muscle mass. Studies in athletes often find that weight-based equations such as Mifflin-St Jeor underestimate resting energy use.
- You are pregnant, breastfeeding, under 18, or managing a medical condition. Calculators are not built for these situations, so talk to a doctor or registered dietitian.
- Your job or lifestyle swings widely from week to week.
If you need a precise figure for clinical reasons, indirect calorimetry measures resting energy directly and is available through some clinics and research settings.